Reading your DiscoAds reporting
Your reporting shows what DiscoAds is driving — impressions, clicks, and conversions — and lets you see performance over time. This guide covers where to find it and how to read the numbers.
Where your reporting lives
Reporting lives under Reporting & Insights in the left-hand nav. The Overview tab shows your key metrics — Ad Spend, Impressions, Clicks, Conversions, CTR, CVR, CPA, and CPC — with an over-time chart beneath; the Performance tab goes deeper, and Glossary defines every metric in place.
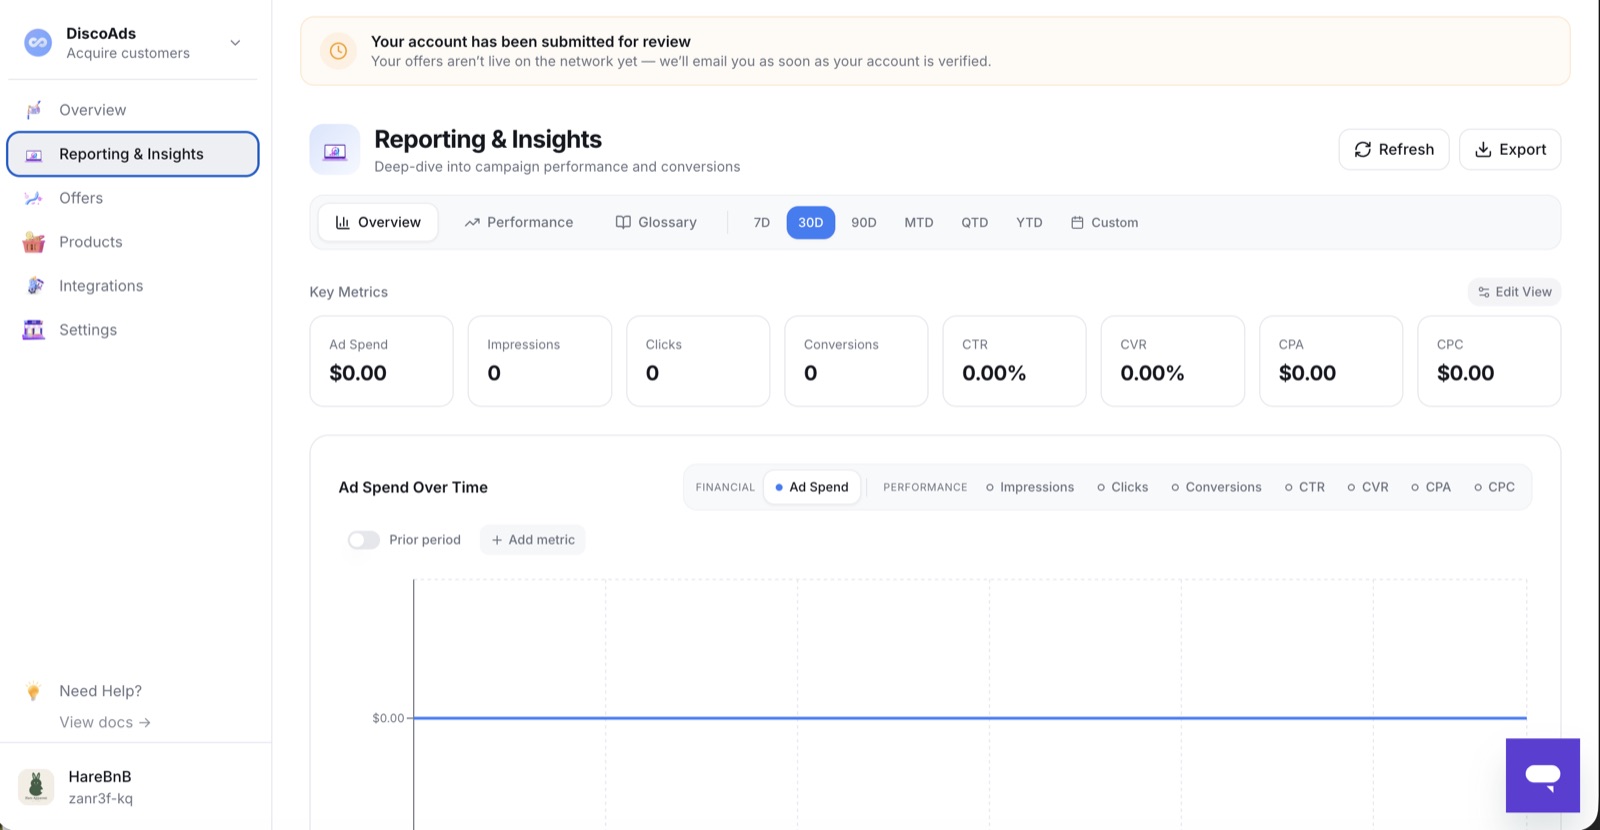
You can set date ranges (7D through YTD, or custom), compare to the prior period, choose which metrics display with Edit View, and Export the data.
Attribution window
A conversion is any purchase made within 14 days of a shopper clicking or viewing your offer. If you evaluate conversions with a different window, set your CPA and CPO targets accordingly, or contact support. For more, see [Disco's attribution model].
Reading early performance
New campaigns go through a short learning period while the model calibrates. Expect early numbers to move around, and give changes a few days before drawing conclusions. If results are soft, start with copy — see Improving creative performance.